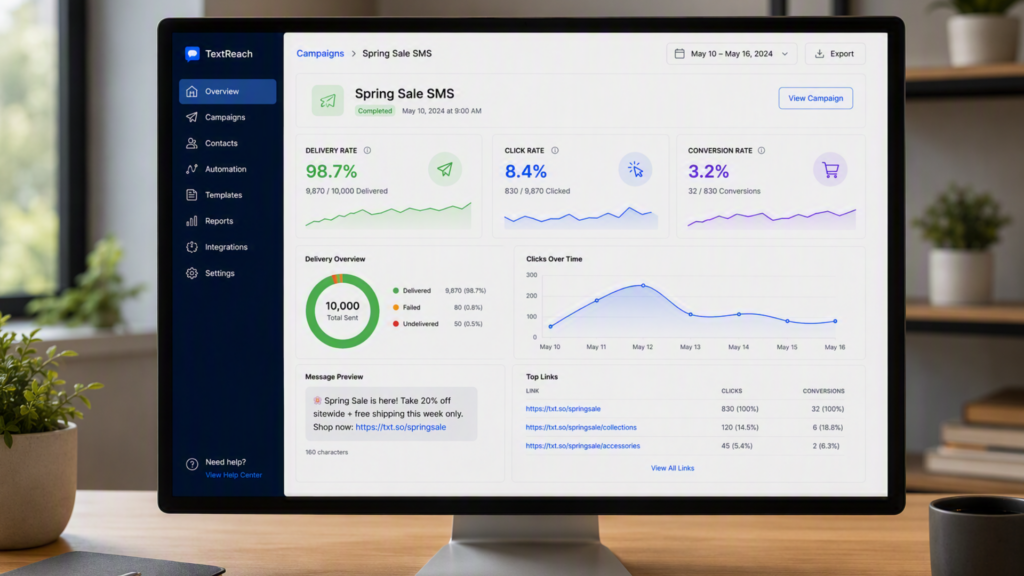
You have sent the message. The credits have gone. The delivery report says “sent.” Job done, right? Not quite. This is usually where most senders stop, and it is exactly where the real value begins. Proper SMS data analysis is what separates a business that sends texts from a business that actually markets through them. It is the difference between guessing what worked and knowing what worked, and it is the single habit that turns an average campaign into a consistently high performing one.
If you have ever looked at your open rates, click numbers or opt outs and thought “so what does this actually mean for me,” you are not alone. Plenty of marketers collect the data but never quite get round to using it. This guide walks through the metrics that matter, how to read them properly, and how to turn raw numbers into decisions that improve your next send.
The metrics you can’t afford to ignore
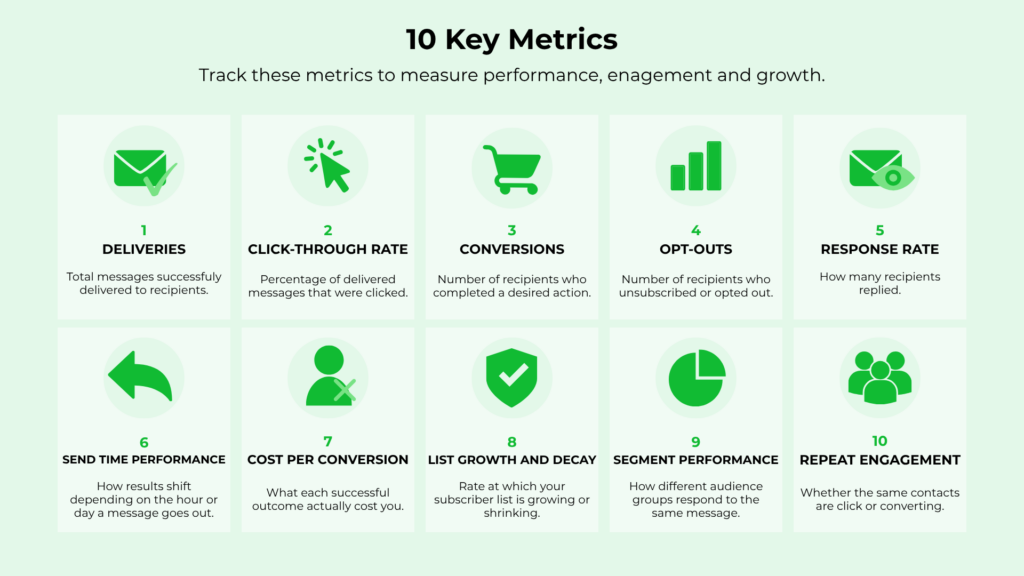
Not every statistic in your dashboard deserves equal attention. Some tell you whether a message technically worked, others tell you whether it actually persuaded anyone. Here are the ones worth building a habit around:
1. Delivery rate. The percentage of messages that reached a handset rather than bouncing. A low delivery rate usually points to outdated contact data rather than a problem with your message itself.
2. Click through rate. The proportion of recipients who tapped a link in your text. This is often the clearest signal of genuine interest, since it requires an active decision rather than passive reading.
3. Conversion rate. How many of those clicks turned into a sale, booking or sign up. This connects your messaging directly to revenue rather than just engagement.
4. Opt out rate. How many people unsubscribed after receiving a message. A spike here after a particular send is one of the fastest ways to spot content or frequency that missed the mark.
5. Response rate. Relevant for two way campaigns, this shows how many recipients replied, which is especially useful for appointment confirmations or customer service style texts.
6. Send time performance. How results shift depending on the hour or day a message goes out. Patterns here can save a surprising amount of wasted spend.
7. Cost per conversion. What each successful outcome actually cost you once credits, discounts and platform fees are accounted for.
8. List growth and decay. Whether your contact base is expanding faster than it is naturally dropping off through opt outs and invalid numbers.
9. Segment performance. How different audience groups respond to the same message. A promotion that flops with one segment might be your best performer with another.
10. Repeat engagement. Whether the same contacts are clicking or converting across multiple campaigns, which often signals your most valuable customers.
Individually, each of these gives you a small piece of the picture. Together, they tell you whether a campaign genuinely worked or simply looked like it did on the surface.
What good actually looks like for a business your size
This is where a lot of comparison charts fall short. A national retailer sending half a million texts a month and a local trades business sending a few hundred are not playing the same game, and their idea of a strong click through rate will look completely different. Rather than chasing an industry average that has nothing to do with your context, it is more useful to build your own benchmark over time.
Start by tracking your first few campaigns as a baseline, then judge every campaign after that against your own history rather than someone else’s headline statistic. A small business that improves its click rate from 8 percent to 12 percent has achieved something genuinely significant, even if a much larger competitor is technically sitting above both figures. Growth relative to your own past performance is a far more honest measure of success than any generic benchmark.
The same logic applies to what failure looks like. A single underperforming campaign is not a crisis, particularly if you can identify why (perhaps a send time clashed with a bank holiday, or the offer was too similar to one sent the previous week). The real warning sign is a consistent downward trend across several campaigns in a row, which usually points to a deeper issue such as list fatigue, poor targeting or messaging that has become repetitive.
Reading engagement trends rather than single snapshots
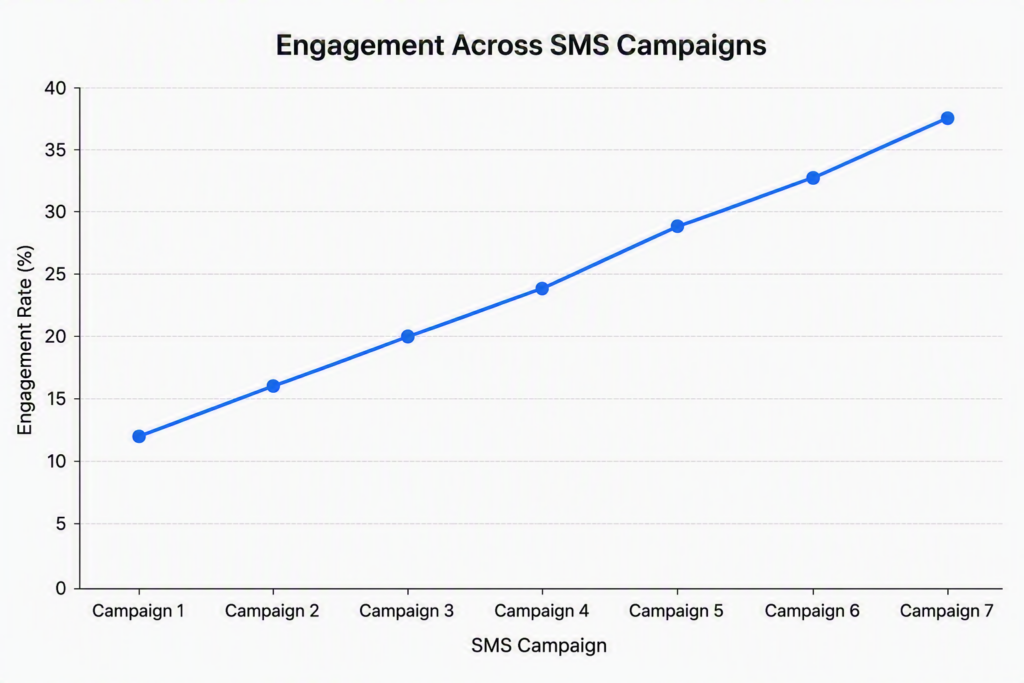
Looking at one campaign in isolation only tells part of the story. Engagement trends emerge when you line up several campaigns side by side and watch how the numbers move. Are click rates gradually climbing as your targeting improves? Is a particular segment consistently outperforming the rest of your list? Are opt outs creeping upward after every third or fourth message, which might suggest you are simply sending too often?
A simple way to start is to keep a running spreadsheet, or better still use a platform with live reporting, and record delivery, click and conversion figures for every campaign you send. After four or five sends, patterns begin to appear that a single report could never reveal. Perhaps weekday sends consistently outperform weekend ones, or messages under 100 characters convert noticeably better than longer ones. These patterns become the foundation of a smarter strategy going forward.
How to measure attribution and track real conversions
One of the trickiest parts of SMS data analysis is proving that a sale actually came from your text rather than happening independently. There are a few reliable ways to close that gap:
- Unique tracked links – Give each campaign its own shortened link so any resulting website activity can be traced directly back to that specific send.
- Dedicated discount codes – A code used only in one campaign makes it simple to see exactly how many purchases it generated.
- Landing pages built for the campaign – A page that only receives traffic from your text message removes any doubt about where visitors originated.
- UTM parameters – Adding tracking tags to your links allows the data to flow straight into your website analytics platform, sitting neatly alongside your other marketing channels.
Once attribution is set up properly, you stop having to guess whether SMS is pulling its weight in your wider marketing plan and start being able to prove it with real figures, which is enormously useful when it comes to justifying budget or planning future spend.
Turning your findings into better campaigns
Collecting the numbers is only half the job. The real value comes from acting on what they tell you. A few practical ways to put your findings to work:
Review your best and worst performing campaigns from the last quarter side by side. What separates them? It might be timing, tone, offer type or even message length. Once you spot the pattern, test it deliberately on your next send rather than leaving it to chance.
Segment your list based on past engagement rather than treating every contact the same way. Recipients who consistently click deserve different messaging to those who have gone quiet, and treating them identically wastes an opportunity to re-engage the latter group with something more compelling.
Keep testing small variables one at a time. Changing the send time, the opening line and the call to action all in the same campaign makes it impossible to know which change actually made the difference. Adjust one element, measure the result, then move on to the next.
How do I measure the success of an SMS marketing campaign?
Success is rarely one single number. It is the combination of delivery reaching your intended audience, a healthy proportion of recipients clicking through, and a meaningful share of those clicks turning into a genuine outcome such as a sale, booking or enquiry, all while keeping opt outs low. A campaign that ticks each of those boxes, even modestly, has done its job. One that only performs well on a single metric, such as high opens but no conversions, still has room to improve.

Bringing it all together with the right reporting
None of this needs to be complicated, but it does need to be consistent. The businesses that get the most out of SMS marketing are rarely the ones sending the cleverest one off message. They are the ones who treat every campaign as a small experiment, review the results honestly, and let the data quietly guide the next decision.
Having a platform that surfaces your delivery and engagement data clearly, without needing to dig through spreadsheets or wait on a report from someone else, makes this whole process far easier to stick with. When the numbers are visible as soon as a campaign lands, spotting a trend or catching an issue becomes second nature rather than an afterthought.
Ready to see what your own SMS data can tell you?
If you want a clearer picture of how your campaigns are performing, our team can talk you through setting up tracking that actually gives you answers, not just numbers. Get in touch with Text Management today to see how straightforward measuring SMS success can be.